> ## Documentation Index
> Fetch the complete documentation index at: https://docs.memeperfect.io/llms.txt
> Use this file to discover all available pages before exploring further.
# Strategy Performance
> Track win rate and performance of your strategies based on alerts sent.
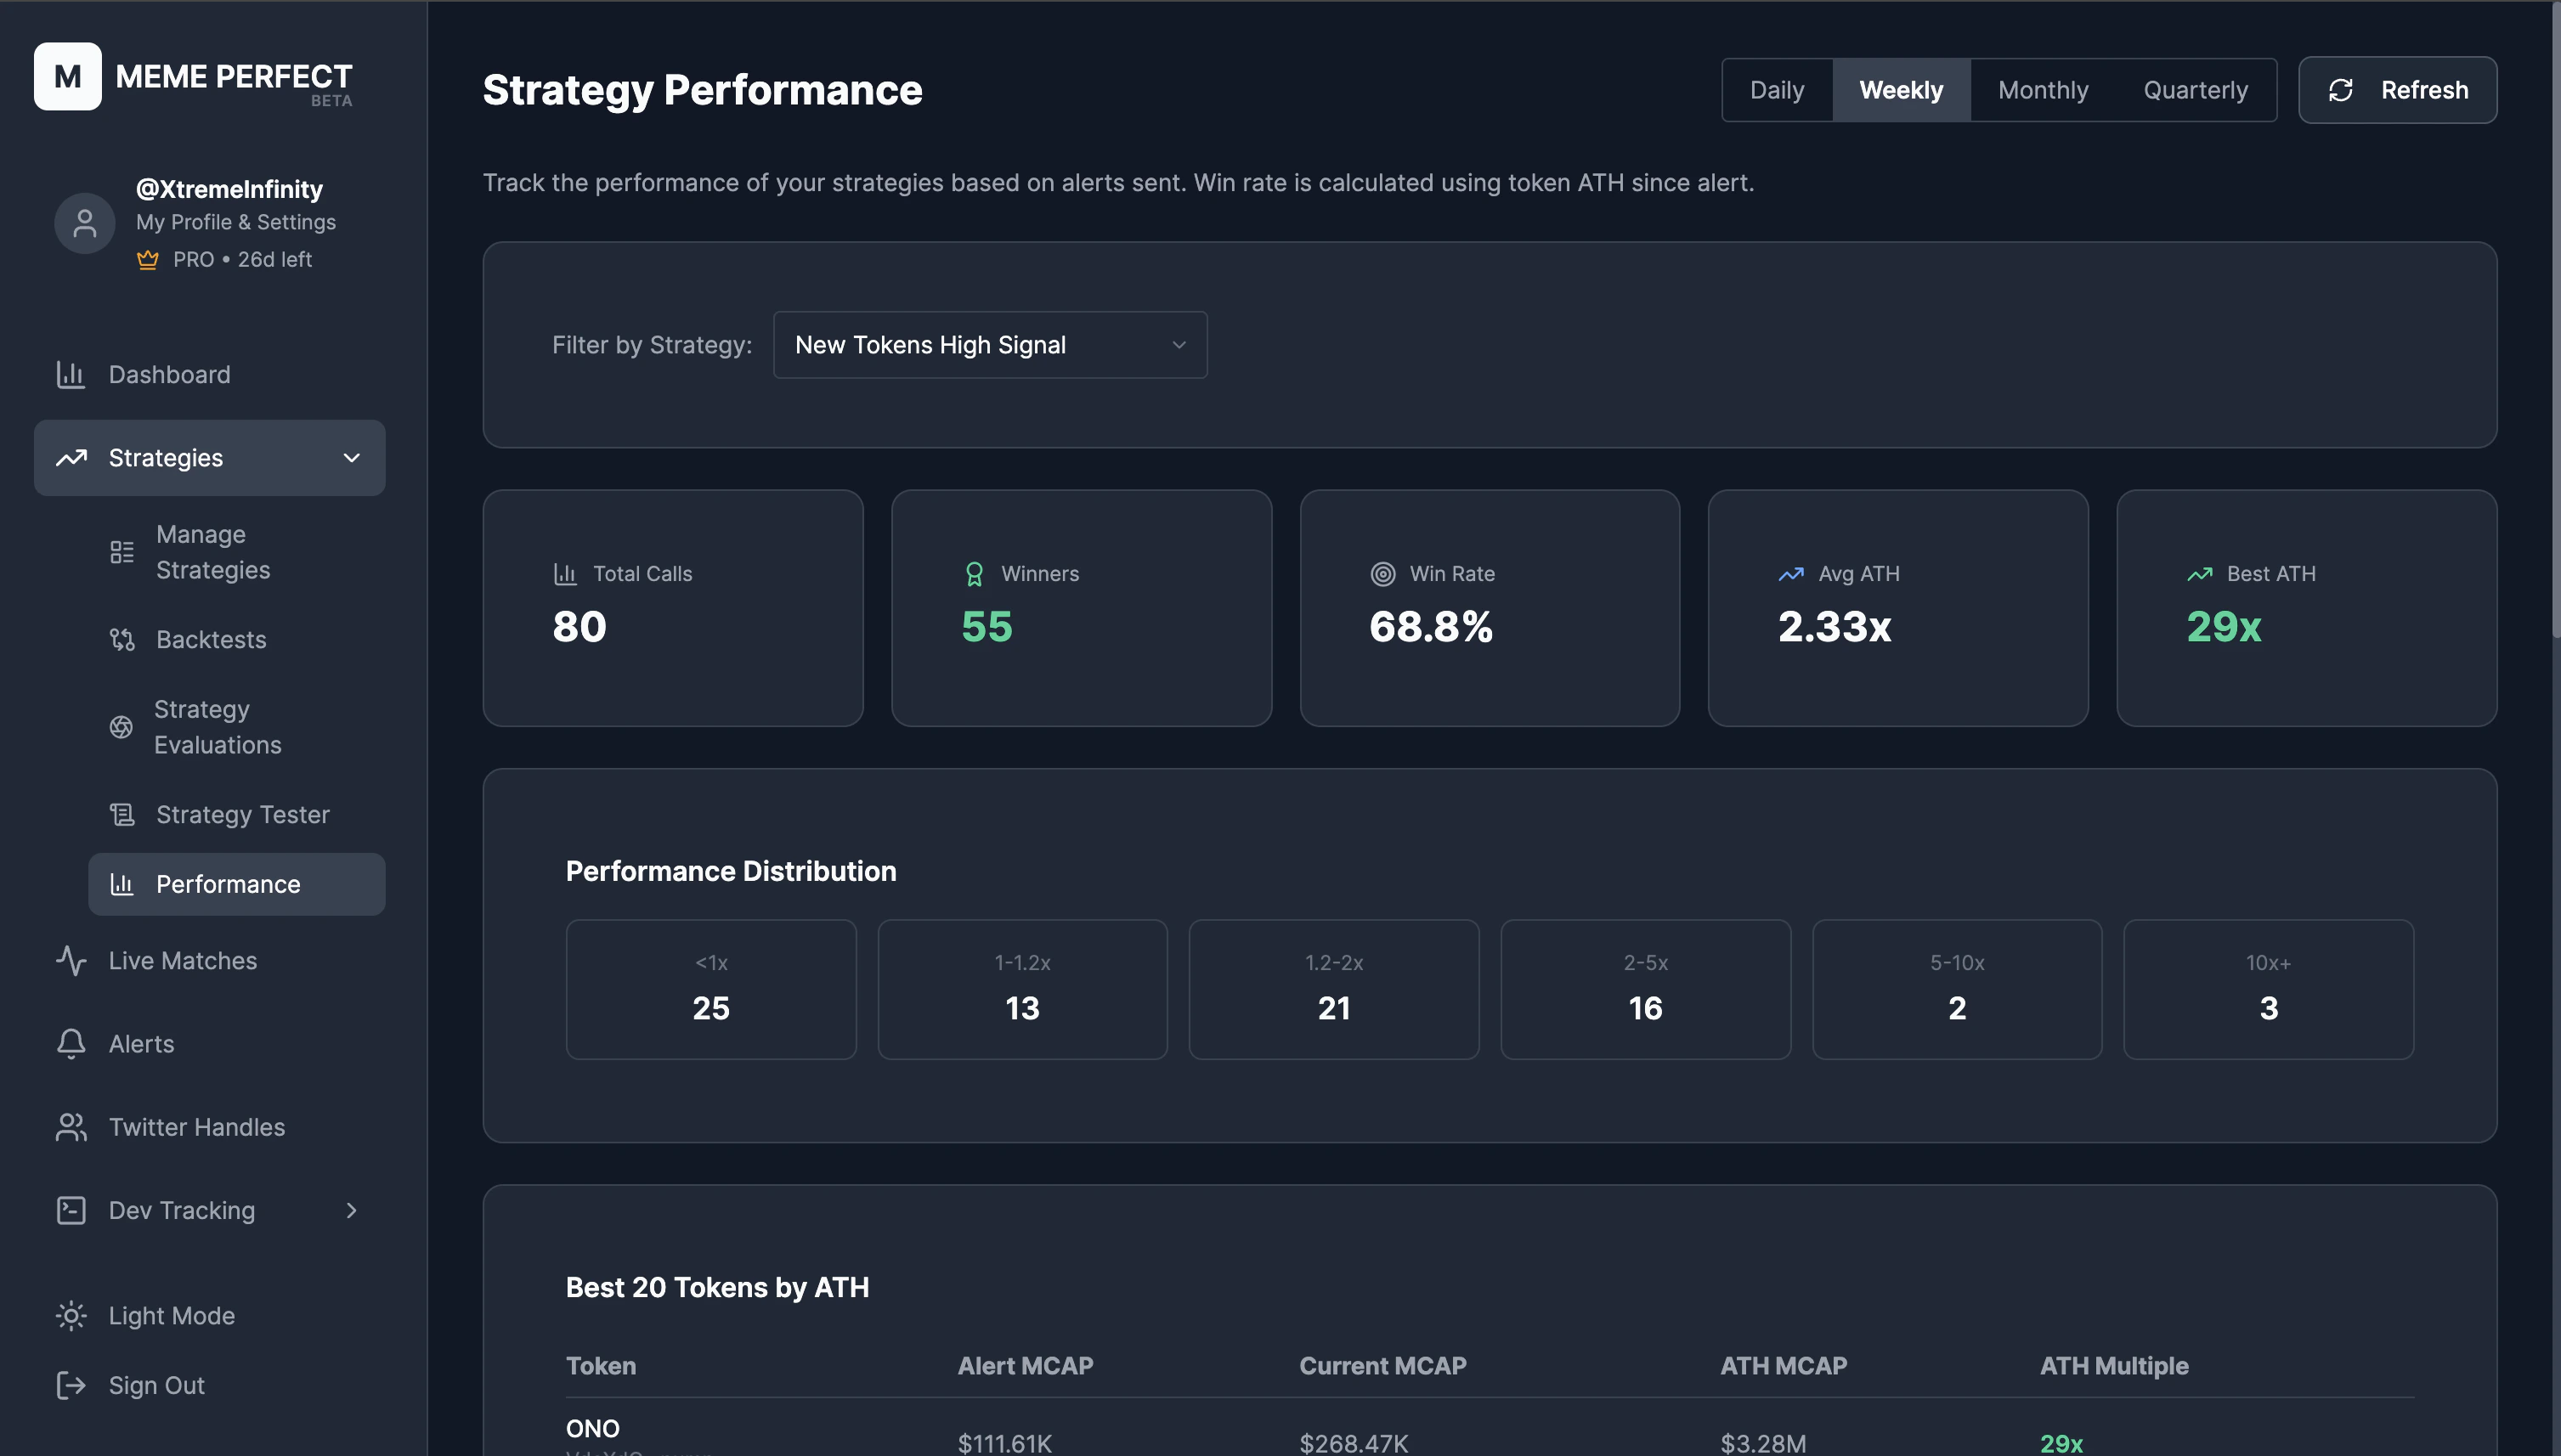
The Strategy Performance page helps you measure how well your strategies perform. You select a strategy and time range, then view win rate, top tokens, and performance distribution.
### How Win Rate Works
Win rate is calculated using **token ATH (all-time high) since alert**. If a token hit a higher price after you received the alert than it had at alert time, it counts as a winner.
This metric answers: "If I had acted on every alert in this period, how many would have been profitable at some point?"
### Using the Performance Page
From the sidebar, go to **Strategies** → **Performance**.
Use the **Filter by Strategy** dropdown to choose which strategy to analyze. Only strategies that have sent alerts will have data.
Select **Daily**, **Weekly**, **Monthly**, or **Quarterly** to define the window for performance metrics.
The page shows Total Calls, Winners, Win Rate, Average Multiple, and Best Multiple. A distribution chart and top tokens list provide more detail.
 ### Metrics Explained
* **Total Calls**: Number of alerts sent by the strategy in the selected range.
* **Winners**: Alerts where the token reached a higher price (ATH) after the alert than at alert time.
* **Win Rate**: (Winners ÷ Total Calls) × 100.
* **Average Multiple**: Average price multiple (ATH / price at alert) across winning tokens.
* **Best Multiple**: Highest price multiple achieved by any token.
### Performance Distribution
The distribution chart shows how wins are spread across multiplier buckets (e.g., 1x–2x, 2x–5x, 5x–10x, 10x+). This helps you see whether most winners are modest gains or include larger runners.
### Top Tokens
The top tokens table lists the best performers in the range, sorted by multiple. You can use this to spot patterns which kinds of tokens (by trigger, liquidity, etc.) tend to perform best.
Processing can take a minute or more for strategies with many alerts. The page shows progress and refreshes automatically when the job completes.
Test strategies against historical data before going live.
Refine rules based on performance insights.
### Metrics Explained
* **Total Calls**: Number of alerts sent by the strategy in the selected range.
* **Winners**: Alerts where the token reached a higher price (ATH) after the alert than at alert time.
* **Win Rate**: (Winners ÷ Total Calls) × 100.
* **Average Multiple**: Average price multiple (ATH / price at alert) across winning tokens.
* **Best Multiple**: Highest price multiple achieved by any token.
### Performance Distribution
The distribution chart shows how wins are spread across multiplier buckets (e.g., 1x–2x, 2x–5x, 5x–10x, 10x+). This helps you see whether most winners are modest gains or include larger runners.
### Top Tokens
The top tokens table lists the best performers in the range, sorted by multiple. You can use this to spot patterns which kinds of tokens (by trigger, liquidity, etc.) tend to perform best.
Processing can take a minute or more for strategies with many alerts. The page shows progress and refreshes automatically when the job completes.
Test strategies against historical data before going live.
Refine rules based on performance insights.